
Everyone has heard the phrase 'the house always wins', haven't they? And, sure, it's true. Every casino in America is designed so that it makes more money than it pays out; that's just the nature of the business.
But here is something you might not know… where you gamble in the US actually makes a bigger difference than most people think.
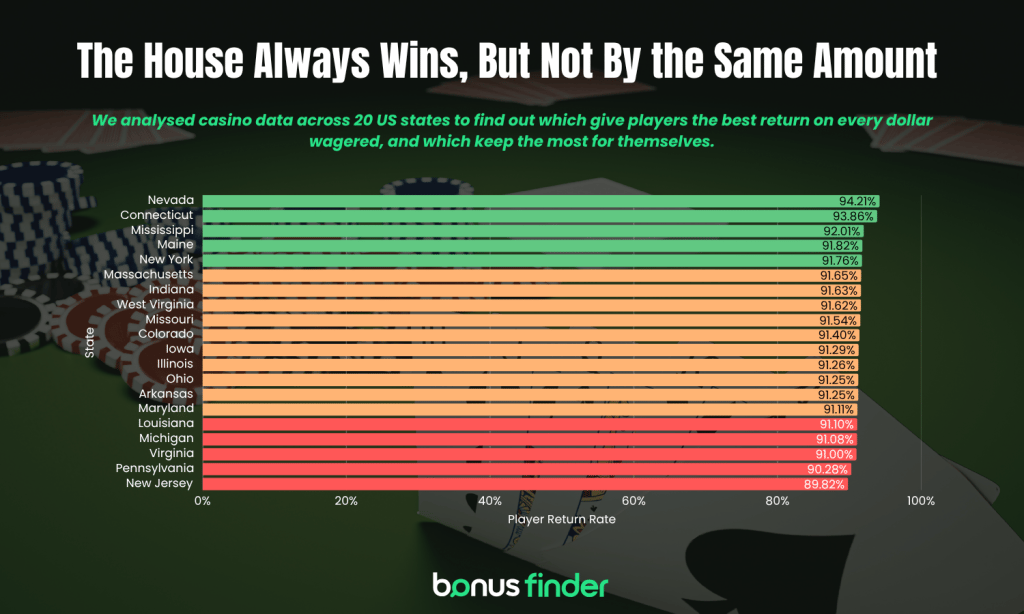
BonusFinder analyzed gaming data from 20 US States to work out exactly how much of every dollar, wagered at a casino, actually makes its way back to players. The gap between the best and worst States is significant, and the results might end up surprising you.
First, let us explain: What does 'the house edge' actually mean?
When you sit down at a slot machine or a blackjack table, the casino has a built-in mathematical advantage. Over millions of spins and hands, this advantage means the casino will always come out ahead.
The number that matters is called the hold percentage — which is the share of every dollar wagered that the casino gets to keep. If a casino 'holds' 8%, it means that for every $100 people put in, the casino keeps $8 and pays out $92 (on average, over time).
It definitely doesn't take a genius to figure out that if you flip that around, you then get the player return rate - how much of every dollar finds its way back to players. In the above example, a 'hold' of 8% means a 'player return' of 92% - otherwise known as the acronym, RTP (return to player).
The lower the hold, the more money players get back and the more generous the State. So, which US States are actually giving players the best deal?
The most generous casino States in the US
Nevada - 94.2% returned to players
It comes as no surprise that the home to the casino capital of the US, and arguably the world, is the most generous. With a hold rate of 5.8% across slots and table games combined, Nevada casinos return more money to their players than any other State in the country.
A huge part of this comes down ultimately to competition - not with other States, but amongst the vast number of casinos in Nevada. Las Vegas alone has hundreds of casinos, all competing for the same customers. The Strip runs tight margins because it has to. If The Bellagio's slots are stingy but the Wynn's aren't, people are going to notice.
Nevada's slot machines, which make up the majority of the casino floor, have an average hold of 7.2%. Table games like blackjack, baccarat and roulette hold more at 14.3% - it might seem like a lot, but it's broadly in line with global casino norms.
Blend those two together, weighted by how much money goes through each, and you arrive at the State's overall hold rate of 5.8%. The slot rate really drives that figure, because slots tend to handle far more money than the tables.
Connecticut - 91.7% returned to players
Connecticut's ranking might raise some eyebrows. It's currently home to only two casinos, yet it lands second in the country for generosity.
The data comes directly from official State reports: Connecticut's tribal casinos hold just 8.33% on slots - incredibly impressive for a two-casino State, and deliberate. Both casinos are popular destination resorts competing for the same visitors across the northeast: New York, Boston and Providence. If one casino becomes known as the 'stingy' option, the other benefits immediately.
Mississippi - 92.0% returned to players
Mississippi isn't always seen as a 'serious' casino destination, but the Gulf Coast has a genuinely impressive casino market. There are several casinos throughout the State, which — like Nevada - puts pressure on operators to keep players happy.
The State also has a long history of casino gaming, being one of the first States to legalize it, and a culture of competitive slot pricing that has kept hold rates pretty low. Slots hold around 9.1% statewide - not as tight as Nevada, but considerably lower than other States in the ranking.
The tightest casino States in the US
Pennsylvania - 90.3% returned to players
Being one of the United States' biggest casino markets, Pennsylvania generates more in gaming tax revenue than any State except Nevada.
Bigger, however, doesn't mean more generous. At a hold rate of around 9.7%, Pennsylvania's casinos keep a meaningfully larger share of player money than the top-ranked States.
A huge part of this is due to the State's high tax rates on casino gambling - among the highest in the country at 54% on slot revenue. When casinos pay more in tax, they usually compensate by tightening their margins with players.
New Jersey - 89.8% returned to players
New Jersey ranked last, with a player return rate of around 89.8%. This is because its casino hub - Atlantic City - has faced well-documented struggles over the past few decades, including: casino closures, competition from neighboring States and a shrinking share of the northeastern gambling market, as more States legalize casino gaming. These pressures have likely pushed operators to protect their profit margins rather than compete on payouts.
It's worth noting that New Jersey is a leader in iGaming, where return rates and competitive dynamics are notably different from the land-based figures we've analyzed here.
Why do different US States have such varying return rates?
It primarily comes down to three things...
1. Competition: States with a large number of casinos, like Nevada or Mississippi's Gulf Coast, have to keep players happy so they stay competitive. Meanwhile, States with limited licenses — such as Pennsylvania, which caps the number of casinos — face far less competitive pressure.
2. Tax rates: When States charge casinos high tax rates, something else has to give. Often, that's the player. Pennsylvania's 54% tax rate is the highest in the country; so it's no coincidence that it also ranks so low.
3. Casino type and age: Older and more established markets with a culture of slot competition, like Nevada and Mississippi, tend to run tighter hold rates than newer markets still trying to recoup the cost of building and opening.
What does this mean if you're planning a casino trip?
The difference between a few percentage points might not seem like a lot — and in some cases, it isn't. It only becomes meaningful over the course of a visit if you're spending a considerable amount of time and money there.
If you're putting $500 through a slot machine in a session, the difference between playing in a State with a 7.2% hold (Nevada) and a 9.2% hold (Pennsylvania) is around $12.50 per $500 wagered, on average, over time.
It doesn't sound like a lot, sure, but it can build up quickly over a full casino visit.
The big takeaway is that if you're already playing in a State with a competitive market, the odds are genuinely better for you as a player than in States where casinos have much less competition.
Unfortunately, none of this changes the fact that the house actually does always win. But some houses win a little less than others — and now you know which ones.
Methodology
BonusFinder analyzed 20 US States with legal land-based commercial casino gambling using two key metrics: Gross Gaming Revenue (GGR) — the total amount casinos keep from players after paying out winnings — and total handle, the total amount wagered by players. The hold percentage is calculated as GGR divided by handle. The player return rate is one, minus the hold percentage.
GGR figures are sourced from the American Gaming Association's State of the States 2025 report (covering calendar year 2024). Handle and hold percentage data for Nevada is sourced from the UNLV Center for Gaming Research's Nevada Gaming Win 2024 report.
Connecticut's slot handle and hold figures are sourced directly from the UNLV Connecticut Tribal Casinos Slot Data report (Foxwoods and Mohegan Sun combined, calendar year 2024). Handle figures for the remaining States are estimated using reported GGR and published hold rate benchmarks from State gaming commission reports.
Analysis covers only land-based commercial casino gaming. iGaming (online casino) and sports betting revenue and their respective handles are excluded. Tribal casino data is included where it is the primary or sole source of legal gaming in a State (Connecticut). Player return rates represent population averages across all players and sessions and do not predict individual outcomes.