
Ask most Americans what they think of when they think of Las Vegas, and the answer has been the same for decades: casinos — the bright lights, the card tables, the slots, the sportsbooks and the shows. Gambling has always been one of the main reasons Vegas exists.
But having spent time looking at how people actually search for Las Vegas trips — what they type into Google before they book — a very different story emerges. One where the Raiders, the Golden Knights and Formula 1 are changing the conversation. Where a night at a musical residency is as likely to be as strong as a reason for a trip to Sin City, as a seat at the blackjack table. And where, for the first time, sports tourism is threatening to overtake entertainment as the city's second-biggest visitor draw.
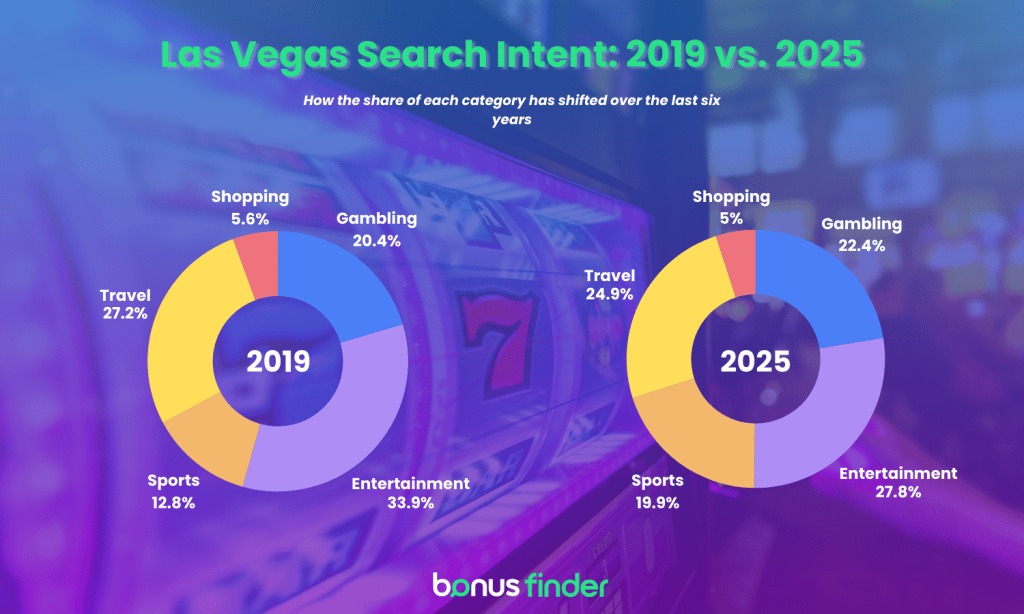
BonusFinder has analyzed six years of Las Vegas-related search data, tracking 34 keywords across five intent categories from January 2019 through 2025, to map precisely how visitor intent has shifted. Here's what the numbers show.
Sports is now Las Vegas's fastest-growing tourism category
In 2019, sports-related searches accounted for 12.8% of all Las Vegas trip intent. By 2025, that figure had risen to 19.9% — a proportional increase of over 55%. No other category comes close.
| Category | 2019 Share | 2025 Share | Change |
|---|---|---|---|
| Sports & Major Events | 12.8% | 19.9% | +55.3% ↑ |
| Gambling / Casino | 20.4% | 22.4% | +9.7% → |
| Experience & Travel | 27.2% | 24.9% | -8.6% ↓ |
| Entertainment & Shows | 33.9% | 27.8% | -18.0% ↓ |
| Shopping & Retail | 5.6% | 5.0% | -11.3% ↓ |
The sports surge isn't organic, gradual growth — it's the product of three specific, transformative events in Vegas over the last decade: the arrival of the Las Vegas Raiders, the Vegas Golden Knights becoming a genuine championship contender as well as the launch of the Formula 1 Grand Prix in 2023.
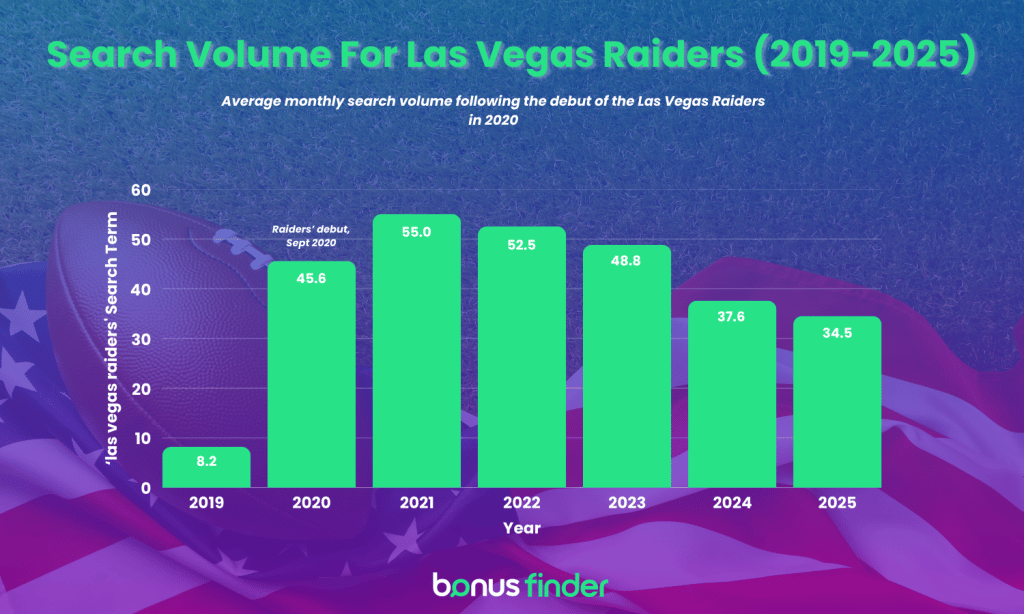
The Raiders effect: A 456% search spike
When the Raiders relocated from Oakland and played their first home season in Las Vegas in 2020, the search data shifted immediately.
By 2021, following the team's first full season in Allegiant Stadium, the Raiders' search index had climbed to 55 — its highest point on record. Even by 2025, after some of the initial novelty had worn off, searches were still running at 34.5 on average — more than four times the pre-arrival level in the city.
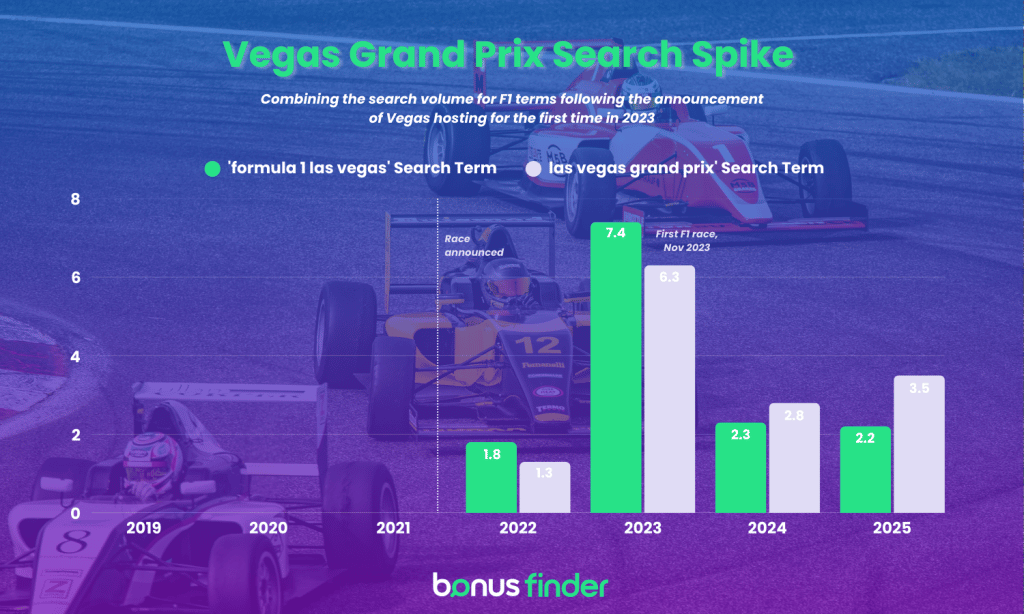
Formula 1: Zero to major destination term in one year
'Formula 1 Las Vegas' registered zero search interest before 2022. Then the first Las Vegas Grand Prix was announced, and something remarkable happened:
| Term | 2021 Avg | 2022 Avg | 2023 Avg (Race Year) | 2025 Avg |
|---|---|---|---|---|
| 'formula 1 las vegas' | 0 | 1.8 | 7.4 | 2.2 |
| 'las vegas grand prix' | 0 | 1.3 | 6.3 | 3.5 |
The inaugural 2023 race didn't just spike in November — it drove sustained search interest for the entire year, contributing to 2023 recording the highest sports search share in the dataset at 24.6%.
Entertainment: Never fully recovered from COVID-19
Entertainment & shows was the dominant search category in 2019, accounting for 33.9% of all Las Vegas search intent — more than gambling, more than travel, more than sports. But it peaked that year and has trended downward ever since...
The pandemic hit entertainment harder than any other Sin City category. When the city shut down in March 2020, show-related searches collapsed by 63% in a single year. Other categories bounced back quickly when Vegas reopened. Entertainment hasn't — at least not to its pre-pandemic heights.
| Term | 2019 Avg | 2021 (Reopening) | 2025 Avg | Change vs 2019 |
|---|---|---|---|---|
| 'las vegas shows' | 35.8 | 26.9 | 22.7 | -37% |
| 'vegas shows' | 53.4 | 39.5 | 34.4 | -36% |
| 'las vegas concerts' | 12.3 | 8.3 | 10.7 | -13% |
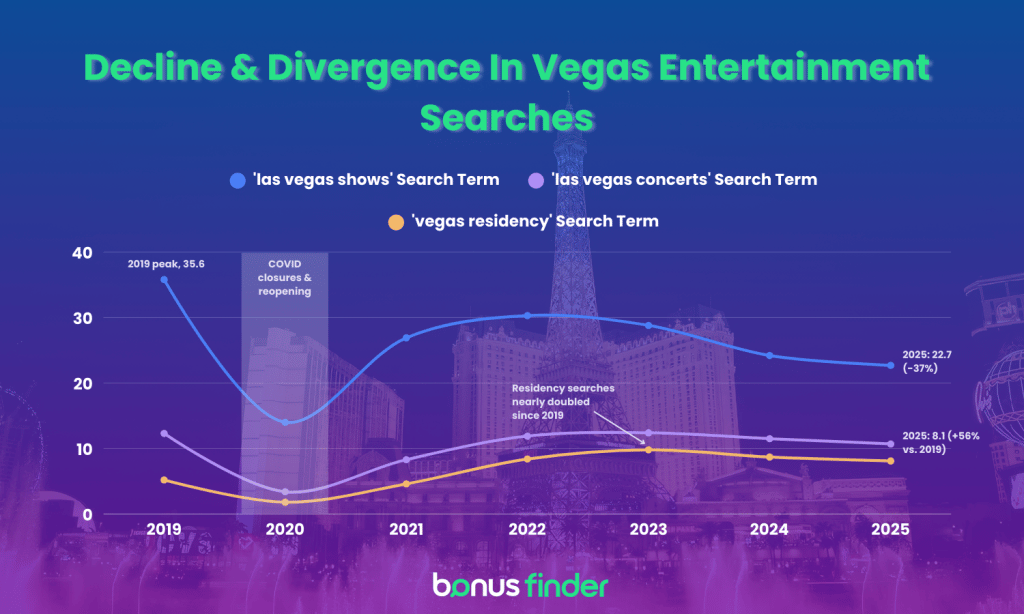
There is one bright spot: artist residency searches. The 'vegas residency' search term has nearly doubled from an average index of 5.2 in 2019 to 8.1–9.8 across 2023–2025.
This suggests that while general show and concert demand has softened, audiences are increasingly motivated by specific residency acts — especially with the opening of new venues such as the Sphere.
Gambling: Holding steady, but losing ground proportionally
Here's the most nuanced finding for anyone interested in, or operating in, the casino space: gambling-related search volume has barely changed over six years. The numbers are almost completely stable.
But here's the catch: in a market where total Vegas-related search interest has been growing and diversifying, flat absolute numbers mean declining relative importance. Gambling's share of total Vegas search intent — 20.4% in 2019 — has barely changed, and its apparent increase to 22.4% in 2025 is a mathematical result of entertainment searches falling faster.
The single most-searched gambling term in the dataset, 'casino vegas', still commands one of the highest individual keyword averages of any term tracked in our research, consistently sitting around an index of 50–60. But it's now competing for attention against sports and entertainment, terms that simply didn't — or hardly — existed five years ago.
Experience & travel: A post-pandemic boom that faded
The Experience & travel category — which covers searches like 'vegas restaurants', 'things to do in las vegas', and 'vegas vacation' — had an interesting story arc across the data collection period.
After a predictable COVID-19 slump, it surged strongly in 2021–2022 as demand drove a wave of leisure travel. 'Vegas restaurants' hit a peak average index of 50.5 in 2021 — its highest point in the dataset — signaling that dining had become a genuine primary motivator for Vegas trips. By 2025, that had moderated to 35.3, still above pre-pandemic levels in absolute terms.
More revealing is the trajectory of 'things to do in las vegas', which declined from 17.3 in 2019 to 11.4 in 2025. That steady drop likely reflects a behavioral shift: tourists now arrive with a more specific agenda, searching directly for a game, a show, or a restaurant.
What this means for the Las Vegas gambling industry
The data we've collected tells a coherent, consistent story: Las Vegas is undergoing a slow but measurable identity shift — from a gambling-first city to a sports and entertainment destination that also happens to have world-class casinos.
For casino operators, that's not necessarily bad news. Gambling volume hasn't fallen — it's the context and attitudes around gambling in Vegas that have changed.
More visitors are now likely arriving primarily for sports events, residency concerts, or restaurant experiences, and are then choosing to gamble as part of a broader trip agenda.
But it does raise a question about the long-term marketing positioning of Vegas casinos. In a city where sports tourism is the fastest-growing search category and entertainment searches are declining, doubling down on casino-first messaging may increasingly miss the actual intent of a visitor who's typing 'Las Vegas Raiders tickets' into Google.
Key takeaways
- Sports searches are up 55% as a share of total Vegas intent since 2019 — the fastest-growing category in the dataset by a wide margin.
- The Raiders' arrival in 2020 drove a 456% spike in sports-related searches that has never reversed.
- Formula 1 Las Vegas went from zero to a major search term in a single year, driving 2023's record sports search share of 24.6%.
- Entertainment searches have fallen 18% in share terms, and show searches are down 37% in absolute terms since 2019 — a trend that predates and post-dates COVID-19.
- Gambling search volume is nearly identical in 2025 to 2019 — stable, but declining in proportional relevance as the total market diversifies.
- Restaurant and dining searches surged post-COVID 19 and remain elevated, reflecting dining as a core component of the modern Vegas trip.
Methodology
This analysis is based on relative search index data for 34 Las Vegas-related search terms across five intent categories: gambling/casino, entertainment & shows, sports & major events, experience & travel, and shopping & retail. Data covers monthly averages from January 2019 through 2025.
Category scores represent the mean of all constituent keyword indices within that category. Percentage shares are calculated as each category's mean index divided by the sum of all five categories for that year.
All growth figures compare against 2019 baselines unless otherwise stated. 2020 data is included throughout but noted as a COVID-19-distorted period where relevant.